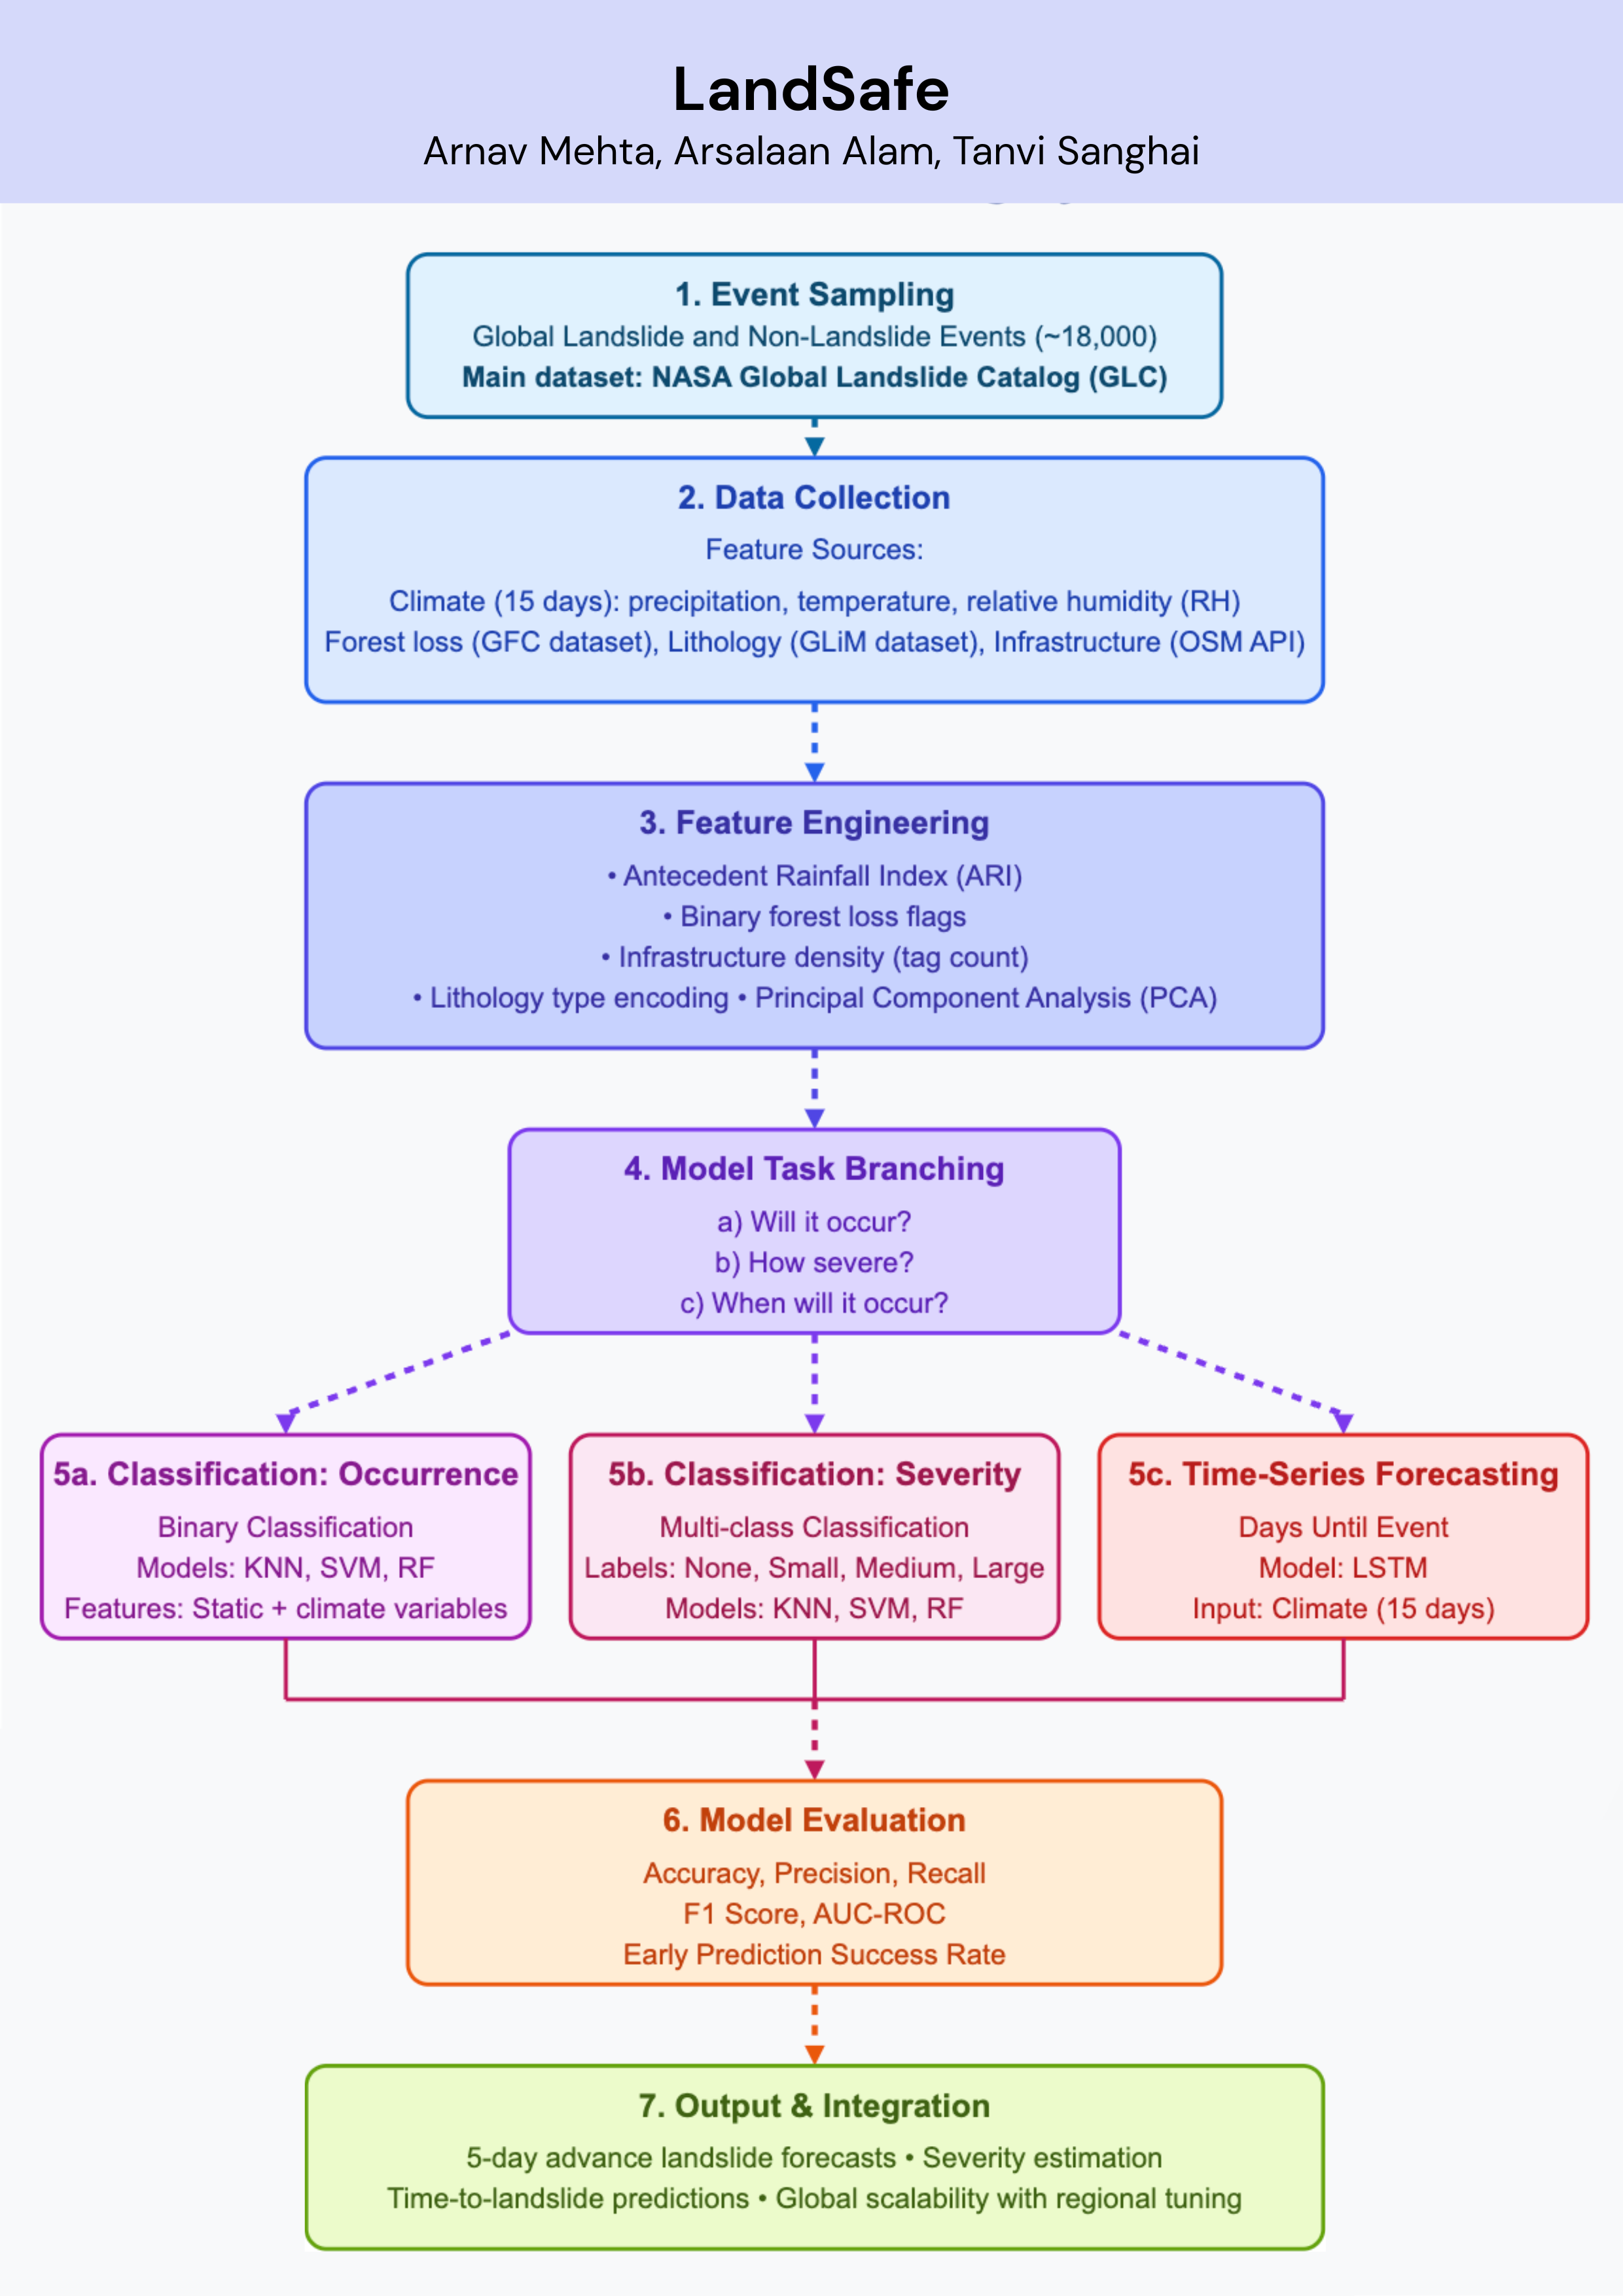
Landslides pose serious threats to human life and infrastructure, yet timely forecasting remains a major challenge due to the complex interplay of environmental and anthropogenic factors. Existing systems such as NASA’s LHASA offer limited detection accuracy (8–60%) and operate on basic decision tree models with static features. This study presents LandSafe, a machine learning-based landslide forecasting system trained on over 18,000 events globally. The system integrates dynamic climate variables: precipitation, temperature, and humidity (retrieved for the 15 days preceding each incident). This methodology also includes attributes such as forest loss, lithology, and infrastructure proximity.
Feature engineering methods include the computation of the Antecedent Rainfall Index (ARI), binary forest cover loss & PCA to reduce dimensions. For classification tasks, K-Nearest Neighbors (KNN), Support Vector Machine (SVM), and Random Forest (RF) models are evaluated to determine landslide occurrence and severity. A time-series LSTM model is employed to predict the number of days until a potential landslide event, leveraging historic and temporal dependencies in climate data. Results are benchmarked against current systems using precision, recall, F1-score, and AUC-ROC metrics. Landsafe offers improved accuracy and generalizability across diverse geographies, making it a viable and scalable solution for proactive landslide early warning.
Artificial Intelligence has demonstrates good performance at detecting anatomical structures and decreasing inter-operator differences during esophagogastroduodenoscopy EGD procedures . However the use of AI remains underutilised in guiding adherence to various examination protocols during EGD procedures. Early gastric cancer (EGC) detection continues to be hindered by inconsistent procedural coverage and blind spots, often caused by non-standardized examination techniques. While existing protocols such as the ESGE 4-image documentation and the Systematic Alphanumeric Coded Endoscopy (SACE) offer baseline structure, they are insufficient for ensuring complete mucosal visualization. The SSS-Kensho-Yahoo protocol attempts to overcome these limitations by dividing the stomach into 21 distinct regions, promoting a more thorough inspection. Despite its potential, routine compliance with such a detailed protocol is challenging due to time constraints, variability in endoscopist expertise, and the absence of real-time procedural feedback.
This paper presents an AI system to support live implementation and adherence of the SSS-Kenshō-Yahoo protocol which aims at eliminating blind spots while providing full mucosal coverage of stomach. The project applies two step approach which combine Vision Transformers and Video Vision Transformers to acquire spatial and temporal characteristics in data The training of our models takes place using GastroHUN dataset which has 8,834 images along with 4,729 labeled video sequences extracted from evaluations of 387 patients by four expert annotators.
It is essential to understand the way seizures develop in the course of time for building predictive and reactive healthcare systems. Our research studies the temporal dynamics of epileptic seizures from EEG signals with a focus on changes in neural signal features preceding and during seizure episodes. Using the CHB-MIT Scalp EEG dataset, we preprocess signals using filtering, normalize signals and segment them. We have used techniques like wavelet transforms and frequency band analysis are used in feature extraction.
To maintain interpretability, we use Decision Trees, Random Forests, and Hidden Markov Models (HMMs) to examine temporal trends in derived features. These models enable visualization of how certain EEG features evolve during seizure phases, facilitating more intuitive clinical evaluation. Our design aim to provide transparent and explainable features, allowing neurologists to better comprehend and rely on the system's output in real-world scenarios.
Accurate and timely flood forecasting remains a critical challenge in disaster management, particularly in regions with diverse terrain and limited historical data. Traditional methods often treat flood prediction as a binary classification task, using either remote sensing or environmental data alone. This reduces the robustness and interpretability of the forecasts.
This study presents a multimodal regression-based framework for predicting flood risk using temporal satellite imagery and spatial tabular data. Sentinel-2 imagery was obtained from Google Earth Engine, capturing a seven-day sequence prior to recorded flood events. These images were processed through cloud masking, normalization, and resampling across selected spectral bands to produce standardized input patches. Environmental and infrastructural data, including rainfall, river discharge, temperature, elevation, land cover, and soil type, were sourced from public datasets. These features were cleaned, encoded, and matched to the corresponding image locations.
The model combines a convolutional neural network (CNN) to extract visual features from the satellite sequence, a multilayer perceptron (MLP) to represent structured tabular inputs, and a long short term memory network (LSTM) to capture temporal trends. The components are trained using quantile regression to produce flood probability estimates as intervals rather than single values, allowing for better uncertainty calibration. This approach improves predictive accuracy and provides more reliable early warnings for flood-prone areas.
Automatic Speech Recognition (ASR) has seen much development in recent years, and finds importance in its application for dysarthric speech. Patients with dysarthria, owing to their disease, have a hard time communicating with others and benefit greatly from ASR systems. Current ASR models developed for dysarthric speech recognition are trained for individual speakers and hence cannot be generalised to a broad population, limiting their accessibility.
This project presents an ASR system using the wav2vec 2.0 model to obtain high-level vector representations that can accurately extract dysarthric speech representations, which are then passed through a Bi-Directional LSTM with attention to provide a transcript of the input speech. Audio files are acquired from the TORGO dataset, and silence from the ends of each file is removed while retaining the gaps in between words to ensure the model only extracts feature representations of speech.
The metric used is Word Error Rate (WER) and Character Error Rate (CER) to test model performance. Currently, the model has a WER of 51.15% and CER of 30.54%. This performance indicates a promising direction for dysarthric speech recognition without any pre-training. Further training and fine-tuning are planned to reduce the WER and CER of the model, and applicability of the solution.
Manual identification of bird species is time-consuming and inaccurate for large-scale biodiversity surveys. Previous methods based on HMMs, SVMs, and CNNs enhanced efficiency but were prone to noise, overlapping calls, and rare species. Our approach employs a hybrid CNN-Transformer model with multi-label classification and few-shot learning to improve the detection of rare species. We also propose the Song Richness Index (SRI) as a novel metric of avian biodiversity.
We gathered varying audio data through passive acoustic sensors in habitats. The recordings were transformed into spectrograms through MFCCs and STFT and then spectral augmentations and adaptive noise reduction were applied. The techniques were adopted to address central challenges such as background noise, class imbalance, and overlapping calls.
Our model outperformed baseline approaches, demonstrating strong generalization across diverse acoustic environments. Few-shot learning enhanced detection of infrequent species and maintained reliable performance even under overlapping call conditions. While balanced accuracy and F1-score metrics are not yet available, preliminary results indicate promising effectiveness. The SRI provides a quantitative, scalable solution for biodiversity monitoring, supporting conservation efforts through automated acoustic analysis.
Chronic wounds, like diabetic foot ulcers (DFUs), affect millions and require continuous monitoring to prevent complications, including infections and amputation. Current methods, such as manual dressing removal and ex vivo analysis, are time-consuming and costly. To address this, Plaksha University’s Center for Equitable and Personalized Healthcare proposes a smart SF-embedded pyranine wound dressing for real-time, non-invasive pH monitoring.
We propose a machine learning model trained on microscopic images of SF hydrogels in simulated wound conditions. The model provides: (1) pH estimation through color changes in pyranine, indicating wound healing, and (2) analysis of hydrogel degradation using image segmentation, informing the user about the bandage’s shelf life.
Our data consisted of images we collected data in a lab environment by observing well-plates containing hydrogels under a stereomicroscope. After preprocessing the dataset containing about 1500 images, 33 features were extracted from them. 24 Hue-Saturation Values (HSV) histogram features were obtained by converting the image into HSV color space and flattening the values into a 1-dimensional vector and the remaining 9 features were extracted by performing performing 3 statistical moments across the RGB colour channels of the image. These features were fed into a Random Forest Classifier which yielded an accuracy of 0.90 in classifying the images into the 4 classes based on pH (‘pH5’, ‘pH6’, ‘pH7’, ‘pH8’).
This project aims to take the first step in realising the potential use of smart sensor bandages in harmony with artificial intelligence for non-invasive monitoring and assessment of chronic wounds.
Cricket is a sport which generates a lot of statistical data. Metrics like runs, shot and ball type, and length are recorded for every over and are usually averaged to communicate the efficacy of players. Teams often use these metrics to curate their lineup of 11 players as well as decide which bowler to play against particular batsmen. Such analysis is aided by using machine learning techniques to predict the outcome of matches.
Current implementations of cricket predictive systems are severely limited in their scope. They fail to properly contextualize matchups and game states, alongside player styles and tendencies. Holistically modelling the effect of these factors on the decisions that batsmen and bowlers make will provide a comprehensive understanding of how to optimize bowling plans and strategies, alongside providing a deeper understanding of the game.
To implement this, we created spin factor and pace factor, which are metrics to quantify the pitch conditions. We are also using ball by ball data in One Day International matches from the past 2 decades. We are using a Long Short Term Memory (LSTM) model in order to predict the final score from a given game state. Ultimately, this system represents a more all-encompassing solution to analyzing and predicting team performances from a variety of game states.
With the rising need to boost agricultural productivity, early disease detection in crops using satellite based monitoring has become increasingly important. Our project focuses on leveraging time series Sentinel-2 data combined with meteorological data to classify crops into four categories: Healthy, Stressed, Diseased, and Pest-infested.
We designed a deep learning pipeline that captures both spatial features and temporal trends in crop health. This architecture combines Convolutional Neural Networks (CNNs) to extract spectral features from 16-band Sentinel-2 imagery with Long Short-Term Memory (LSTM) networks to analyze shifts in vegetation indices, spectral signatures, and environmental conditions across multiple passes and corresponding meteorological data.
For preprocessing, we applied band-wise normalization to the satellite imagery and resized all raster data to a uniform 128×128 resolution. Categorical features such as district and irrigation type were encoded using label encoding. Outliers in both satellite and meteorological data were handled using threshold - based filtering and statistical methods. To address class and imbalance across the categories, we applied oversampling and undersampling techniques to augment underrepresented classes.
Our final CNN + LSTM model achieved a F1 score of 0.75, demonstrating the effectiveness of merging spatial, spectral and temporal information.
Social Media platforms like Twitter play an important role in disaster management by helping emergency relief agencies assess damage, allocate resources and direct relief efforts on the basis of tweets by people. However, current classification models often misinterpret figurative language such as sarcasm, metaphor, hyperbole, etc. as literal disaster event, leading to false positives and misallocation of resources. For example, a tweet like “The economy just got hit by a tsunami”, a metaphor may be misclassified as an actual disaster and might lead to false alarm.
While research has explored individual literary device detection using transformer based models and multimodal approaches in generic contexts, limited work addresses their cumulative impact on disaster related tweets. Studies done in context of disasters often fail to account for the nuanced features of human expression such as punctuation, capitalization and emojis. This project addresses that gap by building a classifier that differentiates between literal and figurative language in tweets containing disaster related keywords by retaining syntactic, stylist and emotional cues.
Our dataset was taken from Kaggle which was obtained using keyword based filtering for disaster terms (e.g., “ablaze”, “earthquake”) from Twitter. Our methodology includes a four-phase pipeline: rich text feature extraction (punctuation, capitalization, emojis), text cleaning and linguistic pre processing, TF-IDF and categorical encoding, sentiment analysis, and feature combination. Our model which utilised Gradient Boosting achieved an accuracy of 0.6813 ± 0.0158 and a weighted F1 score of 0.6813 ± 0.0161. The performance depicts the significance of retaining stylistic and emotional pointers at the stage of pre processing as well as illustrating the capability of multi figurative literary device detection to improve the disaster response system in real time.
Polycystic Ovary Syndrome (PCOS) is an endocrine disorder that affects women from their childhood years (ages 15 to 44). It impacts an estimated 2.2% to 26.7% of women in this age group. Common symptoms include infertility, irregular menstrual cycle, obesity, excessive production of male hormones, and hirsutism. In many cases, PCOS is diagnosed only after a woman faces symptoms or complications emerge, which often leads to chronic diseases like cardiovascular and diabetic issues. The critical gap lies in the early detection, particularly identifying ovarian follicles when they are still in the size range of 2–9 mm, which can significantly improve health outcomes.
To address the issues, this paper proposes a highly accurate follicle detection approach to PCOS diagnosis via ingesting Mask R-CNN, for its ability to detect and segment even the smallest structures in ovary ultrasound images. The model is trained on a large, well-annotated dataset comprising around 3859 ultrasound images of infected and non-infected ovaries. The dataset has been split into test, training, and validation with 772, 2315, and 772 images, respectively. Extensive evaluation using metrics like mAP(mean Average Precision) and IoU(Intersection over Union) confirms its clinical relevance and precision. The model was able to achieve a classification accuracy of 98% after using it on test data. This allowed us to start working on the next part of the project, which is segmentation.
Unlike conventional methods that focus on detecting larger cysts or offer only coarse localization, our model aims to excel at identifying cysts at an early stage, well before symptoms escalate into chronic diseases. Our approach will use Mask R-CNN fine segmentation that has achieved significantly better mean average precision and IoU scores, excellent recall, minimal false positives, and real-time detection. It generalizes across various ultrasound scans from different patients and was also better than the baseline CNNs and control methods. This is important because it demonstrates the model's excellent clinical relevance and potential for the true early diagnosis of PCOS with AI.
Emotion Recognition in Sarcastic, Code-Mixed (Hinglish) conversational data lies at the niche end of the field of Affective Computing. While the same problem in English (only) datasets has been explored, not much has been done in the multilingual aspect. Through this project, we aim to address this missing avenue by building on top of an already existing Code-Mixed (Hinglish) dataset, WITS (based on data collected from the Indian television program - Sarabhai vs Sarabhai).
We labeled the WITS dataset manually, on the majority emotion leading to the use of sarcasm in a conversation. The emotions are of 4 types - Anger, Surprise, Ridicule and Sad. Following this, we used FastText text model, and RESNET-50 to give us text (100-D) and video (2048-D) embeddings respectively. Additionally, we also explored creating video embeddings using our custom CNN.
These embeddings (FastText and ResNet-50) have been primarily passed through two models. First : A simple architecture - Random Forest Classifier, which takes an input of simply concatenated text and video vector embeddings (2148-D). This model gave us an overall weighted average F1-score of 0.53. Second : SNN-AFM (Shallow Neural Network relying on Attention based Fusion Mechanism) - Here, dimensionality reduction is carried out with Principal Component Analysis (PCA) to control feature complexity. The next steps include using a Text Encoder, which is a simplified neural network that transforms reduced text features (from PCA) into a 32-dimensional hidden representation, and a Video Encoder which has a similar structure that transforms reduced video features (from PCA) into a 64-dimensional representation. This follows the Attention-based Fusion mechanism which combines text and video features by dynamically assigning attention weights to each of the modalities. Finally, a Classifier which is the final linear layer in the network, is used to output emotion class probabilities. This approach gave us a weighted F1-score of 0.51. Both these models outperform the nearest SOTA (Emotion Recognition for English language only) which is weighted F1-score of ~0.42.
In summary, out of the two models used, Random Forest Classifier gives us the best performance, on recognizing emotions in code-mixed (Hinglish) data.
The challenge of generating expressive and coherent drum accompaniments remains a significant barrier for solo guitarists and independent musicians. Traditional solutions such as DAW-based programming or loop libraries are either time-consuming or musically generic, often failing to reflect the intricacies of a guitarist’s performance. Prior research in this space primarily utilizes symbolic MIDI data and sequence models like RNNs or Transformers to produce drum tracks, but these often suffer from repetitive patterns, weak structural awareness, and limited audio fidelity.
Our project aims to address these limitations by leveraging a hybrid architecture that combines Self-Similarity Matrices (SSMs), Transformer networks, and Diffusion Models to generate realistic and stylistically responsive drum accompaniments from guitar tracks. Unlike previous models, which separately predict rhythm and dynamics or rely on MIDI-only input, our multitask system jointly learns to predict both the drum SSM and the corresponding drum Mel-spectrogram, enhancing temporal precision and musical alignment.
The dataset was constructed by performing source separation on 710 publicly available multitrack metal and rock songs using Demucs, yielding paired guitar and drum audio. Mel-spectrograms and SSMs were extracted using Short-Time Fourier Transform (STFT) and cosine similarity for feature representation. The Transformer was trained in a multitask setup using cross-attention layers to condition drum generation on both guitar structure and timbre. A diffusion model was then used to reconstruct the drum audio waveform from the predicted SSM, constrained by learned structural priors.
Evaluation includes both objective and subjective measures. Quantitative metrics such as Polyphony Correlation (PC), Bar Rhythm Density Correlation (BRDC), and Velocity & Micro timing Mean Squared Error (MSE) assess timing fidelity, rhythmic density, and dynamic realism. Subjective evaluations involve human listening tests and expert musician feedback to assess creativity, groove, and structural fit.
The Air Production Unit (APU) is a critical subsystem in metro trains, responsible for generating and distributing compressed air required for vital operations such as braking, door mechanisms, and suspension systems. A failure in the APU can significantly disrupt train performance, leading to safety risks, delays in commuter services, and high emergency maintenance costs. In urban transit systems, where millions depend on timely transportation, even a single unexpected APU failure can cause cascading disruptions across multiple lines. Traditional maintenance—reactive or preventive—is either inefficient or overly conservative. Predictive maintenance, by contrast, uses data to anticipate faults, enabling timely and cost-effective interventions. In this project, we address fault prediction and Remaining Useful Life (RUL) estimation in the APU system using the MetroPT-3 dataset—a multivariate time-series dataset collected from analog and digital sensors installed on operational metro trains. Prior work has explored anomaly detection and fault classification using models like Random Forests, Autoencoders, and LSTMs. However, they fail to estimate component-wise Remaining Useful Life (RUL).
We propose a unified pipeline integrating fault detection, fault-type classification, root cause analysis, and RUL estimation. After preprocessing and class balancing with SMOTE, a soft voting ensemble (Random Forest, SVM, Logistic Regression) detects faults. Fault types are classified using a cascading Random Forest. SHAP values identify key features for root cause insights. Finally, an LSTM model estimates RUL by capturing temporal dependencies in the sensor data.
Our framework improves fault management in metro systems by combining explainability, accurate classification, and time-series-based RUL forecasting. It enhances operational reliability, reduces costs, and supports safer, smarter rail transit infrastructure.
The recent interest in health, fitness, and personalized nutrition has emphasized the importance of micronutrients(vitamins and minerals), but most current food recommendation systems are macronutrient-based(proteins, fats, carbohydrates). Furthermore, the lack of understanding of how micronutrients impact physiological function and disease prevention is a limitation of existing methods. To address this issue, we created a series of machine learning-based personalized food recommendation models to include both macro- and micronutrient data from a collection data set. Our work is geared towards gym-goers, health-oriented populations, and users who want different food options with similar varieties. We trained models individually, using K-Means clustering, DBSCAN, and Autoencoders, to recommend food items based on nutrient similarity and which ones were best characterized by the features. Each model was evaluated independent of one another assessing its effectiveness to recommend foods that would help reach the users' nutritional goals. The models underwent data pre-processing procedures to assist with data handling, missing values, feature values, and standardize the amount of performance identified with each model. The results indicated that each of the models improved recommendations of foods substantially better than conventional approaches. This assists with a more detailed look into individualized diet planning recommendations towards a user who cares about their health. Future efforts could examine including dynamic processes relating to user profiling and different health metrics that could further improve recommendations.
This project aims to improve the forecasting of air conditioner (AC) sales by integrating hyper-local weather data with transaction-level sales records from nine cities. Traditional models like ARIMA often fail to capture the non-linear, region-specific nature of weather-influenced demand. To address this, we develop a hybrid machine learning pipeline combining Random Forest, LSTM, and Cyclic Boosting to produce forecasts that are not only highly accurate but also interpretable and scalable.
We began by applying Principal Component Analysis (PCA) for dimensionality reduction, training a Random Forest Regressor that achieved an R² of 0.993 and RMSE of 2.34. While promising, this setup lacked feature interpretability. To enhance model depth and temporal awareness, we are incorporating LSTM networks, while Cyclic Boosting strengthens performance on rare or high-variance sales patterns, improving robustness during sudden weather shifts.
Interpretability is central to our approach. Using SHAP (Shapley Additive Explanations), we provide transparent insights into how features like humidity or wind speed drive each prediction—making the model more trustworthy for business use.
Beyond forecasting, the solution supports supply chain optimization, enabling smarter inventory planning, minimizing stock imbalances, and making operations more adaptive and cost-efficient under climate variability.
Out of all the U.S. power outages reported from 2000 to 2023, 80% of them were due to weather-related events. Such events cost the economy billions of dollars and can put lives at risk. Thus, it’s essential to predict such events. While power outage prediction models exist, high accuracy has been proven difficult to achieve for several reasons. Existing models were developed with data from a few events only and were bound to specific regions, limiting the extent of their applicability across geographies and other events. We present an approach specifically designed for predicting the power outages caused by extreme weather events. Our model that can make accurate predictions for various weather events and does not have a limited geographical region. All of the data has been collected from government sources or widely trusted APIs, we had multiple datasets which we combined based on their timestamps and location information to create a single high quality dataset suitable for training our model. We trained a Random Forest model, as it showed the best accuracy when compared with Decision Trees, Gradient Boosting, SVMs, KNN, Naive Bayes, on a small subset of the data. To evaluate the performance of our model we relied on AUC-ROC, accuracy, precision, recall, and F1-score.
Accurately forecasting India’s Goods and Services Tax (GST) revenue is essential for effective fiscal planning and policymaking. Reliable predictions support optimized resource allocation, improved budgeting, and economic stability. However, the complex interplay of economic, market, and policy factors poses significant challenges. Previous studies have explored methods such as ARIMA, exponential smoothing, TBATS, Artificial Neural Networks (ANN), and Neural Networks for Autoregression (NNAR). While hybrid models like Theta-TBATS have shown promise in capturing nonlinear seasonal dynamics, they often assume linearity or lack interpretability, limiting their use in volatile macroeconomic conditions.
This study uses a hybrid forecasting framework integrating Seasonal ARIMA (SARIMA), Gated Recurrent Unit (GRU), and XGBoost models to predict GST revenue from July 2017 to April 2025. The dataset was curated from government portals, GST Council reports, and financial sites, incorporating features such as RBI rate, Sensex, price of USD in INR, Nifty Pharma Index, FMCG Pharma Index, and Automobile Pharma Index. Preprocessing included engineering time-series features such as lags, rolling statistics, and cyclical encodings. SARIMA captures trends and seasonality, GRU models long-term dependencies, and XGBoost accounts for nonlinear macroeconomic interactions. Ensemble strategies (SARIMA+GRU and SARIMA+XGBoost) refine SARIMA residuals to enhance accuracy.
Performance metrics such as Root Mean Squared Error (RMSE), Mean Absolute Percentage Error (MAPE), and R² score can evaluate the models’ effectiveness. RMSE quantifies error magnitude, MAPE provides relative error insights, and R² reflects explanatory power. These metrics validate the framework’s potential to deliver robust, interpretable forecasts, aiding fiscal planning under dynamic conditions.
Initial Public Offerings (IPOs) are high-risk investment opportunities due to limited historical data and unpredictable early market behaviour. Traditional methods of assessing listing gains rely heavily on manual analysis of Red Herring Prospectuses (RHPs), financial metrics, and subjective expert opinions. This study proposes a novel hybrid machine learning framework that integrates unstructured textual data from RHPs, structured market indicators from the NIFTY50 index, and categorical retail sentiment from public forums to predict IPO listing gains.
Combining qualitative, quantitative and sentiment analysis data for an IPO, we plan to construct a multimodal model that gives binary output of success or failure. We tested different models such as Logistic Regression, Random Forest, and XGBoost, and measured their performance using metrics like ROC-AUC, F1 Score, and Precision/Recall. We consider an IPO successful if its listing price is higher than its issue price. To make sure the results were reliable, we used cross-validation during testing.
Our approach enhances traditional analysis methods by using data-driven techniques to identify subtle patterns across different types of information. The results demonstrate the potential of this integrated methodology to deliver more accurate and scalable predictions, offering data-driven decision-making tools for retail investors navigating IPO investments.
Globally, lung cancer is one of the top-ranking causes of cancer mortality in patients, requiring the advancement of early detection to improve outcomes for these patients. Most studies have focused on either single resolution datasets or have not maximized on the complementary information existing in multi-resolution data sets. The project works on closing this gap through developing a pipeline that stacks CT images of the same anatomical location but with different slice thicknesses in order to improve the accuracy of classification for lung nodules.
We relied on the publicly available RIDER dataset to structure the data as indicated by the metadata provided (patient ID and image position) in order to align slices through the consideration of different slice thicknesses, all within a anatomical region. The DICOM files were loaded and pre-processed through normalization and resizing to ensure consistency, we applied histogram equalization to enhance the visibility of lung nodules and subtle anatomical features like lesions since CT scans suffer from low contrast and intensity variability.. An image stack was created by merging slices corresponding to the same anatomical position with different resolutions. We selected a Convolutional Neural Network (CNN) for classification owing to its capacity of obtaining spatial hierarchies in image data, with characteristics learned directly from the stacked images.
Our baseline CNN model achieved an accuracy of 81% and an F1-score of 0.75 on the validation set.
Post-traumatic stress disorder (PTSD) is a mental health disease that is associated with several emotional, physical and psychological symptoms that occurs after experiencing traumatic events. The estimated risk of developing PTSD after such exposure is around 14% in the general population, 24% in the young urban population, and 10-30% in the combat veteran population (Rozgic et al., 2014). PTSD diagnosis currently relies on subjective assessments prone to bias and inconsistency. Previous approaches have focused on single modalities (Marmar et al.'s speech-only model, AUC=0.954) or required specialized equipment (Rozgic et al.'s EEG/ECG sensors). Our approach uses a non-invasive speech and facial data to capture the dynamic temporal manifestation of PTSD symptoms during clinical interviews.
We utilize the Extended Distress Analysis Interview Corpus (E-DAIC) dataset, which contains audio-visual recordings of clinical interviews with 275 participants. It includes standardized PTSD assessments using the PCL-C (PTSD Checklist-Civilian Version), with the participants labelled as PTSD-positive if their scores are beyond the clinical minimum threshold of 35. Our preprocessing pipeline integrates pre-extracted speech features (BoAW, MFCC, eGeMAPS) and facial features (Action Units, pose, gaze) from OpenFace. We implement a dual-branch LSTM architecture with cross-modal attention to model the temporal dynamics of symptom manifestation, a critical aspect often overlooked in static approaches. This architecture enables detection of delayed symptom expressions (e.g., vocal stress preceding facial micro-expressions).
Our current model achieves an AUC of 0.5972, accuracy of 0.6056, and F1 score of 0.4135 on the test set. While these results demonstrate the feasibility of multimodal PTSD detection, ongoing improvements to feature extraction and model architecture aim to enhance performance.
Our project focuses on solving the problem of video captioning and context creation using data from text, audio, video and image formats and emotional sentiment analysis using separate CNNs for each modality. These models have been combined into a final system which can generate context or captions based on the most probable emotion. Moreover, we have primarily used the MELD dataset for the text, audio, and video features in conjunction with other datasets like MSRVTT, LibriTTS-R and others. For the image data, we used the FER2013 dataset and provided extra images from the CK+ and Emociones datasets as well. Various musses in different environments are incorporated to stimulate real world conversation dynamics. Preprocessing includes tokenization and lemmatization for text, MFCC extraction for the audio and CNNs for facial and body language analysis. This approach aims to improve emotion detection by considering a diverse range of data sources and generating emotion specific captions. Our solution has applicability in human computer interactions, mental health diagnostics and media content creation.
Ovarian cancer remains a significant health threat due to its often silent progression, making detection challenging. Standard methods like CA-125 tests and ultrasounds can struggle with accuracy, sometimes leading to missed cancers or unnecessary procedures. Our project explores improving ovarian cancer classification using machine learning on readily available patient data.
We utilised a public dataset containing tumor markers, clinical details, and haematological results. This dataset comprises clinical and biochemical data from 349 patients, including 178 with benign ovarian tumors and 171 with ovarian cancer. The data was collected from ovarian tumor resection surgeries performed at the Third Affiliated Hospital of Soochow University between July 2011 and July 2018 (Predict Ovarian Cancer, n.d.). After essential preprocessing, including data imputation and scaling, we trained separate Random Forest models: one focusing on tumor markers and another on combined clinical and haematological parameters.
These specialised models were then fused by averaging their predictions. The individual tumor marker model achieved approximately 90% accuracy. The fused model achieved 94.29% accuracy and 94.2% balanced accuracy on unseen test data, demonstrating the potential of combining different data types and multi-omics inspired approach. This fusion approach offers a potentially cost-effective way to enhance ovarian cancer screening using existing hospital data.
Glioblastoma (GBM) is the most severe manifestation of gliomas, a type of primary brain tumour. The prognosis of Glioblastoma tends to be unfavourable with a median survival of 15 months. Therefore, precise survival estimation is essential to enable personalised treatment planning and enable patients to make informed decisions about their quality of life. While, DL models have shown promise, they are heavily dependent on the availability of a wide number of modalities and, therefore, lack generalizability. Moreover, the lack of interpretability hinders their clinical adaptability.
We used UPENN-GBM as our dataset obtained from TCIA, which incorporates four principal elements—MRI, histopathology, radiomics and clinical data. Our preprocessing pipeline included converting DICOM to NIfTI, extracting voxel intensities, using a shallow CNN to extract imaging features etc. Our model integrates LDA for dimensionality reduction and SMOTE for class imbalances, then trains an ensemble of Logistic Regression, Random Forest, and XGBoost classifiers predictions combined via hard voting, tuned through Optuna.
The voting ensemble model performed superior even with truncated features (accuracy: 98%, balanced accuracy: 0.84, c-index: 0.86). With features extracted from CNN, the accuracy was found to be 99% at a c-index of 0.88. Features with the highest representation post LDA and weights from the models provide insights and medical reasoning. Together, this not only allows for more accurate survival prediction but also reveals significant patterns in patient information, improving personalized treatment approaches for GBM.
Parkinson’s Disease (PD), a progressive neurodegenerative disorder, is commonly diagnosed through clinical observation, which often leads to delayed detection, especially in early stages. Prior research has explored deep learning on wearable sensor data to improve detection, but these models are too resource-intensive for real-time or remote applications. Our project proposes a novel, lightweight, and interpretable multimodal machine learning pipeline that integrates wearable sensor signals with self-reported non-motor symptoms and demographic information to enable scalable early diagnosis.
We utilize three datasets from the PADS study: (1) time-series movement data from wrist-worn accelerometers and gyroscopes, (2) structured clinical and demographic metadata, and (3) binary-response non-motor symptom questionnaires. Preprocessing involves noise filtering, binary conversion of data, and feature extraction. We have trained an Omni-Scale Convolutional Neural Network (Omni-CNN) on the movement data to capture fine-grained, multi-scale motor patterns. A neural network was used to model the questionnaire data. By combining the 2 models, we train our model to detect early signs of Parkinson’s disease.
Final model evaluation is currently in progress, with performance to be assessed using accuracy, F1-score, AUC-ROC, and balanced accuracy. We expect the combined data modalities and efficient architecture to support real-time, interpretable PD detection suitable for deployment on consumer-grade wearable devices.
With the increasing demand of Printed Circuit Boards’ (PCBs) due to the rise in demand for high performance computing components like GPUs, CPUs in AI and Software Industry, consumer industry, medical industry, Automotive industry, etc., there is a proportional increase in the need to reduce the defects in PCB manufacturing and to detect any defects to prevent any accidents. The increasing complexity and miniaturization of PCBs have made defect detection a critical yet challenging task in modern electronics manufacturing. Traditional manual inspection is labour-intensive and error-prone, while prior automated methods either often suffer from limited generalization and low accuracy (like AOI, SPI, Xray imaging) or cannot be used at industry level due to low efficiency in terms of speed (like FPN, SE and ROI align model by D.Li , et al; 2020). This project aims to enhance PCB defect detection efficiency while maintaining accuracy using proposing a lightweight, accurate, and fast defect detection system using CNN-based deep learning with semi-supervised learning strategies.
We utilize two datasets: a labelled BarePCB dataset with 20,000 images across 7 classes, and a Solder Paste (SP) dataset with 2,000 images (only 500 labelled) spanning 5 categories. Preprocessing includes image resizing, normalization, focal loss, and augmentations using the Augmentations library. First we classify whether the image is of BarePCB or Solder Paste stage using a two-convolutional layer CNN. Then use separate CNN models for each of the two. In the SP model, we also used Pseudo-labelling and class balancing to address label scarcity and imbalance.
Our final CNN models implementation consists of three convolutional blocks with ReLU activation and batch normalization, followed by max pooling layers to reduce dimensionality. After flattening, a dense layer with dropout regularization is used before the final classification layer. It achieves a macro F1-score of 0.85 and overall accuracy of 85%, outperforming previous approaches using only ML or traditional methods in both efficiency and generalization. The model’s simplicity, speed, and high generalization make it well-suited for real-time industrial PCB quality assurance pipelines.
Fashion recommendation systems typically focus on style, overlooking budget constraints, causing low conversion when users see unaffordable items. Research has explored collaborative filtering and content-based approaches using visual features, but rarely incorporates price sensitivity as a core component. We introduce explicit budget awareness through price sensitivity metrics and utilize efficient text-based feature extraction instead of expensive image processing.
We used the H&M Personalized Fashion Recommendations dataset from Kaggle, containing transactions, article metadata, and customer information.Our methodology follows a five-phase pipeline that prioritizes both computational efficiency and recommendation effectiveness:
Data Preparation: Clean transaction data, process article metadata, and handle customer demographics
Feature Engineering: Create budget-related features, text-based style features, and customer behavior features
Two-Stage Recommendation: Generate candidates first, then rank them
Model Training & Validation: Use temporal validation with gradient boosting models
Pipeline Integration: Build complete workflow with image retrieval
We chose this approach because it addresses the critical budget awareness gap in existing fashion recommendation systems. It uses computationally efficient text embeddings instead of resource-intensive image processing. The two-stage recommendation process balances computational efficiency with recommendation quality Gradient boosting models like LightGBM offer strong performance with mixed feature types.
The primary evaluation strategy in the pipeline is temporal validation, which involves Time-based data splitting and Implicit feedback metrics
Using personal protective equipment (PPE) correctly is crucial for safety on construction sites, but many accidents result from incorrect PPE usage. Many studies have used convolutional neural networks such as Faster R-CNN and SSD to identify the existence of helmets and vests, but they frequently falsely identified PPE when PPE items are simply in the frame, even if they were not correctly being worn. This leads to unsafe misses in monitoring safety compliance. This study helps address an established gap in detection and compliance monitoring by integrating YOLOv8 object detection with HRNet for pose detection to identify PPE items and also verify the equipment is correctly worn on the correct body part to help mitigate safety risk due to misclassification.
The SH17 dataset from Kaggle was acquired and pre-processed through class filtering, standardized image resizing, and augmentation techniques including rotations and flips to ensure model generalizability across diverse scenes. These preprocessing steps were necessary to address class imbalance and improve robustness to variations in camera angles and worker poses. YOLOv8 was selected for its state-of-the-art performance in real-time object detection, particularly its ability to detect small objects in cluttered environments. HRNet was chosen due to its superior capability in preserving spatial information and accurately locating human key points, enabling precise verification of PPE placement.
Our model obtained an accuracy of 60% which will be further improved using image augmentation to increase the instances of each class.
Storms are a major factor in causing power outages, accounting for 62% of all outage events. Accurate prediction of storm-induced outages is critical, as vulnerable populations—such as the elderly and medical patients—depend on continuous power for life-saving devices like ventilators. Additionally, businesses in the U.S. lose billions of dollars annually due to power disruptions, and emergency responders rely heavily on electricity for communication and coordination during crisis situations. However, The current outage prediction algorithms experience challenges in properly assessing and forecasting the effects of moderate and low-severity storms although they seem weaker than stronger storms. Multiple research works utilized unified models which fail to identify the specific patterns within less severe storms. Our project eliminates existing prediction accuracy flaws by creating a storm severity framework which directs storm events to respective machine learning models based on their severity category.
We have used EAGLE-I data merged with NOAA Storm Events and PRISM Climate collections to track U.S. storm incidents together with electricity blackouts and environmental observation data from 2014 to 2023. Random Forest regression performs missing data imputation while the analysis eliminates non-relevant features and features displaying high sparsity as part of the normalization with time zone alignment procedure. Storm and outage records were temporally and spatially matched. We applied NLP techniques (TF-IDF and dimensionality reduction) on unstructured event narratives and integrated structured environmental variables.
We are using a machine learning pipeline where, in the first stage, we predict storm occurrence two hours in advance using a Random Forest Classifier, achieving 92% accuracy. This is followed by a storm severity classification step using XGBoost, which categorizes the storm as low, medium, or high with an accuracy of 86.5%. Based on the predicted severity, separate models are used to determine whether a power outage will occur: LightGBM for low severity storms (95.13% accuracy), Random Forest for medium severity (93.61%), and a feedforward neural network (FNN) for high severity (87.13%). Our predictions outperform current state-of-the-art models for low and medium severity storms, while our high severity model achieves comparable performance.
Startups are key in fuelling economic growth, but most of them fail before certain critical milestones such as initial public offerings or acquisitions. Evaluation methods are mostly anecdotal or limited to specific financial metrics, which are quite often invalid in predicting a startup's long-term success. Previous studies relied on either structured financial datasets such as those in Crunchbase, or market sentiment indicators like Google Trends. No single work has yet attempted to combine these complementary data streams into one predictive framework. This project is thus intended to fill that gap. It plans to integrate structured financial data with sentiment analysis in order to make a machine learning model that predicts the whether a startup will reach a liquidity event within 5 years.
We collected data on startups from Crunchbase for financial data and Google Trends for sentiment. Data pre-processing methods include normalization, handling of missing values and dimensionality reduction techniques such as Principal Component Analysis (PCA). For training the model, we selected Random Forest and XGBoost classifiers because they are robust against imbalanced datasets.
Evaluations were done using metrics of accuracy, balanced accuracy, and F1-score. The developed model showed an improvement in F1 score as compared to models solely based on financial data, proving that combining financial and sentiment features increases predictive power.The metric that is most important to our model is the success prediction accuracy since what matters most is how well we are able to predict whether a company will be successful.
The importance of shifting to clean and renewable energy has been a key point of discussion. Solar energy, in particular, has accounted for 92.12 GW out of the 203.18 GW of clean energy generated in India. Therefore, identifying optimal locations for solar farms, a significant source of solar energy, is crucial and remains an area requiring extensive research. Current models aimed at predicting and selecting optimal sites for photovoltaic farm installations are primarily based on statistical GIS and subjective Multi-Criteria Decision-Making (MCDM). Studies that use artificial intelligence and machine learning are significantly lacking in the Indian context for this domain.
Our model uses an AI-ML approach to predict the optimality of locations for the installation of solar farms. Our dataset is unique to the Indian context, taking into account a multitude of features that we narrowed down from our literature review, such as temperature, wind speed, precipitation, sunshine duration, and distance from roads. This data was obtained from OpenMeteo, OpenStreet Map, and Google Earth Engine. Additionally, the coordinates that make up our dataset consist of 539 coordinates of solar farms and 5396 random coordinates. In preprocessing, we normalised and adjusted our features for direct and indirect relationships with the target. After this, we ran our dataset through AHP matrices to obtain labels/ground truth values.
The model that we used was based on our literature review, which pointed out Random Forest to be the most accurate in this context. Through Random Forest, we were able to obtain an accuracy score of 88%, thus showcasing the ability of AI-ML to solve the problem of predicting the optimality of locations for the installation of solar farms.
Access to clean and functional water sources has remained a critical challenge in rural Tanzania, where most water pumps become dysfunctional soon after installation. This persistent faliure continues to undermine the nation's progress towards Sustainable Development Goal 6. Although machine learning has previously been applied in some studies to classify water pump status, most have overlooked important factors such as geography, institution, and season , relying mostly on default encoding and static features.
Our study revisits the problem with the Pump It Up dataset, from the Tanzanian Ministry of Water and Taarifa, containing 59,400 water points with 40 diverse features, aiming to improve functionality classification with improved data processing and model design. We have implemented a comprehensive preprocessing pipeline that has handled missing data (by imputing 'unknown' and 'not known' values), eliminated redundancy across high-cardinality categorical features, and introduced engineered variables, such as raininess score and management consistency. Frequency and label encoding retained both relational and statistical context.
Our final model achieved 81.09% model accuracy using a Random Forest classifier trained on an 80/20 stratified split as well as having consistent performance across functional and non-functional classes. These results reinforce the potential of interpretable, data-driven models in supporting predictive maintenance and infrastructure planning in resource-constrained settings.
Accurately forecasting electricity demand is crucial for cost-effective energy management, reducing wastage, and maintaining grid stability—especially in the high-stakes context of real-time energy bidding. Traditional forecasting models typically depend on historical consumption trends and weather data. While effective in stable conditions, these models often fail during disruptions such as protests, policy changes, or sudden shifts in public sentiment that significantly alter energy usage.
To address this gap, our project integrates real-time news data from the GDELT Global Knowledge Graph alongside weather features to create a more adaptive and event-aware forecasting model. The underlying hypothesis: external events and news-driven sentiment influence energy consumption behavior in ways that weather alone cannot predict.
We sourced weather and load data from open-access repositories like Kaggle, and extracted news themes, tone scores, and frequency metrics from GDELT. Using XGBoost for its training speed and efficiency, we applied a wide range of time-aware features—including rolling averages, trend tracking, recent sentiment shifts, and theme co-occurrence patterns.
Our initial evaluations show a noticeable improvement in performance when incorporating news data:
- Weather-only model: R² = 0.86
- Weather + News model: R² = 0.93
This uplift demonstrates that news-enhanced models offer better responsiveness, particularly during periods of unusual demand. This approach paves the way for better, real-time energy bidding strategies, and presents a method to make future energy forecasting more accurate and behavior-aware.
Driver drowsiness is a major contributor to traffic accidents, yet most vision based detectors falter under facial occlusions (e.g. sunglasses, hands, beards) and demand heavy compute. We address these limitations by extracting four lightweight, interpretable features Eye Aspect Ratio (EAR), Mouth Aspect Ratio (MAR), head-roll, and head-pitch via MediaPipe on the UTA RLDD dataset. To simulate real-world conditions, we augment videos with synthetic lighting variations and occlusions (sunglasses, hands, beards). A compact 1D-CNN (depthwise-separable, dilated) processes short-term temporal patterns, followed by an LSTM for longer dependencies. We will convert the trained network to a TensorFlow Lite model with quantization and pruning to achieve a sub-5 MB footprint and real-time (> 25 FPS) inference on ARM-class devices. We plan to evaluate our system on held-out occluded data, reporting standard metrics (accuracy, balanced accuracy, F₁-score) to demonstrate its robustness and suitability for in-vehicle safety deployment.
Coral reefs in India are increasingly threatened by climate change, yet most existing coral bleaching assessments remain retrospective, relying predominantly on sea surface temperature (SST) or image-based models. These approaches often neglect region-specific ecological factors and species-level responses, limiting their predictive utility. This study presents a predictive machine learning framework tailored specifically to Indian reef systems, incorporating localized, multi-variable environmental data.
While global studies such as McCalla et al. (2023), which reported a 96% accuracy and an R² of 0.25 using Random Forest models, have advanced coral bleaching prediction, they lack regional specificity necessary for applications in India. Existing research on Indian reefs focuses on documenting habitat degradation and bleaching events but fails to employ predictive modeling based on integrated environmental and ecological features.
Our model leverages variables including SST, pH, fCO2, salinity, temperature, turbidity, coral species composition, Degree Heating Weeks (DHW), and large-scale climatic drivers such as the Indian Ocean Dipole (IOD) and El Niño–Southern Oscillation (ENSO) indices. These features capture India’s distinct monsoon-driven oceanographic conditions and ecological diversity. Data were curated from reputable sources including NOAA, NASA, NCEI, BCO-DMO, and peer-reviewed literature.
After rigorous preprocessing, we employed LSTM neural networks, XGBoost, LightGBM, and Random Forest algorithms, achieving a recall of 0.91 and a ROC AUC of 0.96. By integrating diverse, region-specific variables, our model enhances the accuracy of coral bleaching forecasts and facilitates proactive reef management, offering a scalable and adaptable framework for ecological forecasting in other underrepresented reef systems globally.
The 2015 Gorkha earthquake in Nepal caused varying levels of damage to buildings, depending on their location and construction. Conventional methods for evaluation has been focused on visual/manual inspection, which is labor-intensive and susceptible to human error. Previous studies are mostly based on post-disaster surveys and structural analysis, with little work on predictive modelling for automating the damage assessment process. Our approach seeks to fill this gap by employing data-driven machine learning methods to estimate the damage levels of buildings (low, medium, high) based on structural and locational features, which can lead to more efficient mitigation of the processes.
We used a dataset provided as part of the competition, which included 38 features of building structure and ownership, collected by Kathmandu Living Labs and the Central Bureau of Statistics. After checking for the presence of null values, we applied one - hot encoding on categorical variables, and numerical variables were standardised. Principal component analysis (PCA) was used to select features to include significant variables. We tried various classification algorithms, but neural networks and XGBoost tend to work better because they can learn complex patterns. These models were chosen because they are well-suited for high-dimensional data, can capture nonlinear relationships between features and outcomes, and have demonstrated strong performance in prior disaster-related classification tasks.
We used the micro-averaged F1 score to measure the performance of our models, as the damage grades are ordinal in nature. Our automated method not only outperforms human assessment but also highlights the potential for rapid and scalable prediction of earthquake damage.
The complexities of Hindustani classical music, an artform emerging from the Indian subcontinent's rich culture, require decades to master. Today's fast-paced individuals remain disconnected from this treasure due to declining Guru-Shishya Parampara systems. Novices struggle with raga identification and lack supervised practice, developing incorrect techniques. Raags contain intricate rules with unique touches like gamakas and meends. Previous models (SVMs, PCDs) failed with melodic variations and emotional depth. Our work addresses these gaps using a CNN-LSTM hybrid and underused features like emotion and time-of-day.
Our data collection process included collecting 5,200 audio samples across ten ragas: Ahir Abhogi, Ahir Bhairav, Bageshree, Bhairavi, Bhoopali, Jog, Malhar, Shree, Todi, and Yaman from public datasets and repositories. Recordings were chunked into 20-second segments, yielding approximately 500 samples per raga.
Our preprocessing includes source separation, silence removal, and tonic normalization. A parallel multi-scale CNN with 3×3, 5×5, and 7×7 kernels extracts pitch contours from spectrograms, using three Conv2D layers (16–64 filters) with ReLU, max-pooling, and batch normalization. Outputs feed into bidirectional LSTM layers (2×100 units) with dropout and attention, followed by dense layers (128–256 units) and Softmax for classification. This architecture leverages both local spectral features (CNNs) and long-range melodic patterns (Bidirectional LSTMs), detecting gamakas and modeling temporal dynamics of pakads. Using 80/20 train-test splits, our model substantially outperformed SVMs and HMMs in accuracy, precision, recall, and F1-score across all ragas, validating its usefulness for music learners and preserving Hindustani classical traditions.
Cassava is a major food crop in most African countries that constitutes the source of both food security and farm income. Appropriate farm planning and improvement in crops in Africa relies heavily on estimating Cassava root volume accurately, but the havoc that traditional methods of measurement cause continues to hinder it. In this research project, we offer a new, non-destructive pipeline based on cross-sectional images of cassava roots to estimate root volume through the application of deep learning and advanced image processing. This approach encompasses a much larger scope compared to previous studies that often employed invasive methods or simple geometric models. The applicability of machine learning to non-destructive plant inspection was revealed by Wen et al. (2019) through applying deep learning and ultrasonic spectra to estimate plant water content. Root volume estimation remains largely unexamined.
In the current project, we create a machine learning model to estimate cassava root volume. Our pipeline starts with an advanced image processing phase that combines contrast enhancement techniques, edge-preserving filters, and a multi-level thresholding approach with watershed segmentation to isolate roots with high accuracy even when they exhibit complex morphologies. From the segmented images, we harvest a rich set of shape, texture, and invariant attributes. These attributes together with metadata pertinent to them are combined and subjected to a deep network with residual connections to enhance capacities in learning. The model has a Root Mean Squared Error (RMSE) of 1.074 on the public validation set and 1.385 on the private test set and is ranked 138 on the leaderboard. Whilst the model shows good capacity to estimate average root volumes, its current form shows little variance in predictions to suggest scope to improve generalizability. However, in this work, we introduce a scalable and statistically informed pipeline that forms the basis of significant improvement in root phenotyping for environmental stress studies and crop breeding programs in the near future.
Mainstream recommendation systems reinforce popularity bias, severely limiting exposure for lesser-known artists and diminishing diversity in user experiences. This project addresses the need for fairer music discovery by designing a recommendation model that purposely promotes tracks falling into the category of niche and super-niche without a major compromise to accuracy. While past studies have mostly tapped into collaborative filtering or content-based filtering, they have generally taken the idea of fairness as a post-processing step, resulting in a lack of real-time impact and the unrelenting marginalization of low-stream artists.
We operate on a subset of the Spotify Million Playlist Dataset and construct a user-item matrix from over 200,000 interactions. Non-Negative Matrix Factorization (NMF) techniques are applied to detect latent user and item features, and a reranking mechanism is applied to adjust recommendations according to track popularity segments. This way of implementing fairness is embedded directly in the core of recommendation systems, with a hyperparameter balancing diversity and accuracy.
Evaluation using different metrics further shows that our reranking achieves a 14.7% improvement in diversity (from 0.64 to 0.73), with slight drops in precision and recall as seen from evaluation metrics such as Precision@10, Recall@10, MAP@10, and Diversity Index. The accuracy of the model is 46%. These results indicate that our model effectively bridges the two considerations of fairness and relevance, providing a scalable solution.
This project presents a Library Optimization System aimed at improving both book acquisition and shelf placement within libraries through an intelligent hybrid recommendation framework. While traditional systems often rely solely on collaborative filtering or content-based approaches, our project adopts a novel two-stage architecture that integrates Collaborative Filtering via Spark’s Alternating Least Squares (ALS) algorithm with Gradient Boosting using XGBoost. This hybrid methodology captures both implicit user-item interaction patterns and leverages rich metadata to address issues such as data sparsity and the cold-start problem, which are particularly common in academic library environments.
The dataset used in this study was derived from a large-scale global book catalog, containing over 6 lakh book interaction along with extensive metadata such as titles, genres, authorship, publication details, ratings, and user engagement statistics. Initial preprocessing included deduplication, missing value imputation, and the construction of both sparse and dense user-item interaction matrices. ALS was employed to generate latent user and book embeddings, which were then passed as features into the XGBoost model for refined prediction of user preferences. Feature engineering incorporated book metadata, enabling nuanced learning of user preferences beyond interaction data.
The performance of the system was evaluated using standard metrics such as RMSE, coverage, and novelty. These metrics offered a comprehensive understanding of the model’s effectiveness in generating accurate, diverse, and user-relevant recommendations. The system further translates predicted demand into actionable shelf-placement insights, thereby optimizing not only what the library acquires but also where it places those resources for maximum visibility and accessibility.
By merging the strengths of collaborative filtering and gradient boosting, and incorporating GPU acceleration and distributed processing through PySpark, our model stands as a scalable and efficient solution for modern library ecosystems. It bridges the gap between digital user data and physical resource management, offering a transformative step forward in academic knowledge delivery and utilization.
Over 70% of firms in India are currently investing in influencer marketing, recognizing its effectiveness in reaching targeted audiences. Despite its growing role in branding strategies, selecting the right influencer remains a challenge due to the vast number of influencers and varying engagement rates. Existing models often rely on basic metrics like follower count or subjective selections by agencies, which may not align with brand objectives or foster meaningful collaborations.
This project seeks to optimize influencer selection using a machine learning model that incorporates engagement score, bio similarity, sentiment analysis of comments, and sponsorship history.
The study uses datasets provided by Mr. Seungbae Kim, including influencer, brand, and Instagram post data. Brand sponsorships were identified through post-level analysis during preprocessing.
The proposed framework employs NLP techniques (TF-IDF for text vectorization), sentiment analysis via Gemini AI, and the CatBoost algorithm for classification. Preprocessing included normalization with StandardScaler. These methods were chosen for their strength in handling textual and categorical data, with CatBoost offering solid performance without extensive tuning.
The model achieved 82% precision and 83 F1 score, with 82% recall for the sponsored class. Overall accuracy is under evaluation, with ongoing performance improvements. The current Mean Reciprocal Rank (MRR) score is 0.489, using CatBoost-generated sponsorship probabilities to recommend top influencers to brands.
Social media like Twitter have a very significant effect on market trends, especially in volatile sectors like cryptocurrency. However major portion of these tweets are generated by bots, which will deform the market trend prediction and lead to misleading analyses. Studies have shown that bots can make up to 9% to 15% of active twitter accounts, impacting the validity of the sentiment data. Therefore, to ensure the accuracy of sentiment analysis and volatility prediction , there’s a critical need to filter out bot generated tweets. Previous studies have established a correlation between twitter sentiment and cryptocurrency market value. Even though these studies acknowledged the presence automated account or bots, they did not account their impact on sentiment analysis and hence in market value.
Our project aims to filter out the bot generated-tweets before performing sentiment analysis. After performing sentiment analysis on filtered data, we analyse the positive and negative sentiment over fixed time periods and relate to changes in bitcoin prices. This approach provides a more accurate representation of market sentiment and improves the market value prediction.
We obtained the dataset from Kaggle which comprises of tweets related to bitcoin, collected over a specified period using Twitters’ API by searching for tweets which had hashtags related to cryptocurrency and bitcoin. We pre-processed our data by converting tweets into lowercase, removing links mentions ,hashtags, number and punctuation. Then we used tokenisation, lemmatisation , stemming and removed stop words. We also added features like followers to friend’s ratio and hashtags which are useful in bot detection. The selection of these algorithms was based on their efficacy in handling social media data. For sentiment scores we are using VADER which is known for its effectiveness in analysing social media text.
For finding the bot generated tweets and human generated tweets our model achieved the following performance metrics:-
Accuracy= 77.98%
F1-score= 77%
Precision=83%
Recall=78%
By effectively identifying and filtering out bot-generated content, further steps like sentiment analysis and market value prediction will be based complete human tweets.
Image retrieval is a foundational problem in computer vision, focused on identifying visually similar items from a reference database. Despite significant progress, real-world variations such as lighting, occlusion, and background clutter still present major challenges. Our project aims to improve upon established baselines using a publicly available SKU-level dataset that simulates these realistic conditions in a retail context.
We adopt a Siamese network architecture, widely suggested in prior retrieval literature, to learn a robust similarity function for comparing query and reference images. To build a strong foundation, we first trained a model from scratch, experimenting with multiple loss functions (contrastive, triplet) and distance metrics (cosine, Manhattan, Euclidean). Among these, the combination of Euclidean distance and contrastive loss achieved the best performance on our baseline, reaching a mean average precision at 5 (mAP@5) of 0.070. Incorporating pretrained backbones—ResNet, VGG, EfficientNet—further improved this score. Particularly Efficientnet B4 gave a score of 0.129 keeping the loss and distance the same.
To extend beyond conventional methods, we explored a Vision Transformer-based model, inspired by recent literature but not commonly applied in this setting. This approach delivered the best results, achieving an mAP@5 of 0.195 with the same loss type and distance as used above on the same siamese infrastructure, noting an improvement.
Our findings highlight the effectiveness of combining metric learning with transformer-based architectures, offering a more resilient solution for image retrieval in visually complex environments.
Wildlife monitoring through camera-trap images is vital for conservation, yet manual annotation of vast image datasets is time-consuming and prone to human error. This project addresses the challenge of automating wildlife species classification from camera trap images. Previous studies used clean datasets and haven't relied on site metadata, achieving high accuracy but leading to overfitting and poor generalization. They fail under real-world environmental noise, such as adverse weather, occlusion, and lighting issues. In this project, we propose a Convolutional Classifier for robust wildlife image classification under authentic field conditions, also relying on site metadata.
We obtained a dataset of 16448 camera-trap images located at different sites across 7 species, incorporating scenarios like rain, fog, nighttime, and motion blur from Driven Data Competition. We pre-processed the data using augmentation techniques such as brightness adjustment, rotations, and flips to enhance class balance and environmental resilience. The size of images was changed to fit the desired size for EfficientNetB0 which we used for transfer learning, alongside a custom CNN dense head to benchmark performance trade-offs.
Our model so far has achieved 83.83% accuracy on training data and 80.84% accuracy on validation data, achieving a log loss of 1.8731 outperforming baseline CNNs and proving more adaptable across unseen locations. These results underscore the potential of real-world deployable, resource-efficient vision models in ecological AI.